Using Nagios
The StackLight Infrastructure Alerting plugin configures Nagios to display the health status of all the nodes and services running in the OpenStack environment. The alarms, or service checks in Nagios terms, are created in passive mode, which means that the actual checks are not performed by Nagios itself, but by the Collector and Aggregator agents of the LMA toolchain.
To get an overview of your OpenStack environment:
Log in to the Fuel web UI.
Click Dashboard.
Click Nagios.
Click the Services link in the left panel of the Nagios web UI. You should see the following page:
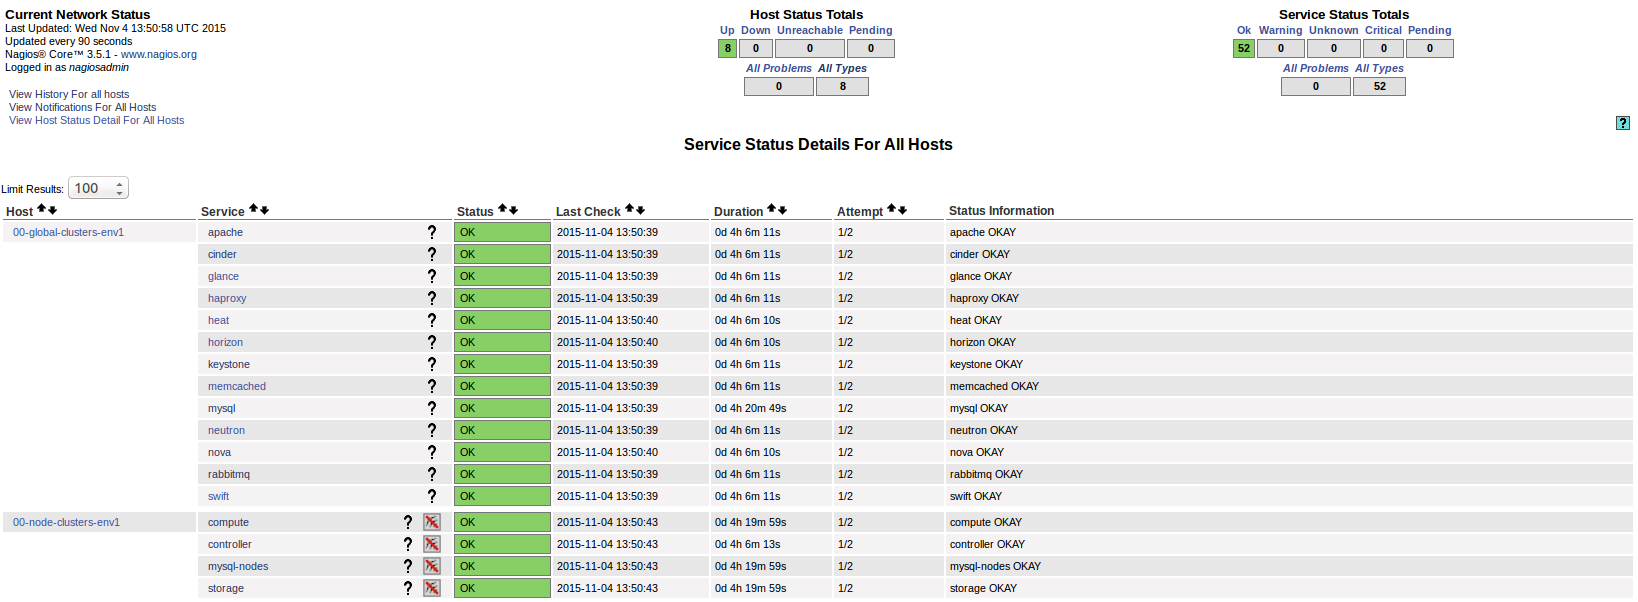
In this dashboard, there are two virtual hosts representing the health status of the so-called global clusters and node clusters entities:
- 00-global-clusters-env${ENVID} is used to represent the aggregated health status of global clusters, such as ‘Nova’, ‘Keystone’, ‘RabbiMQ’, and others.
- 00-node-clusters-env${ENVID} is used to represent the aggregated health status of node clusters, such as ‘Controller’, ‘Compute’, and ‘Storage’.
The virtual hosts section contains a list of checks received for each of the nodes provisioned in the environment. These checks may vary depending on the role of the node being monitored.
Alerting is enabled by default for the global cluster entities. For the nodes and clusters of nodes alerting is disabled by default to avoid the alert fatigue, since these alerts should not be representative of a critical condition affecting the overall health status of the global cluster entities.
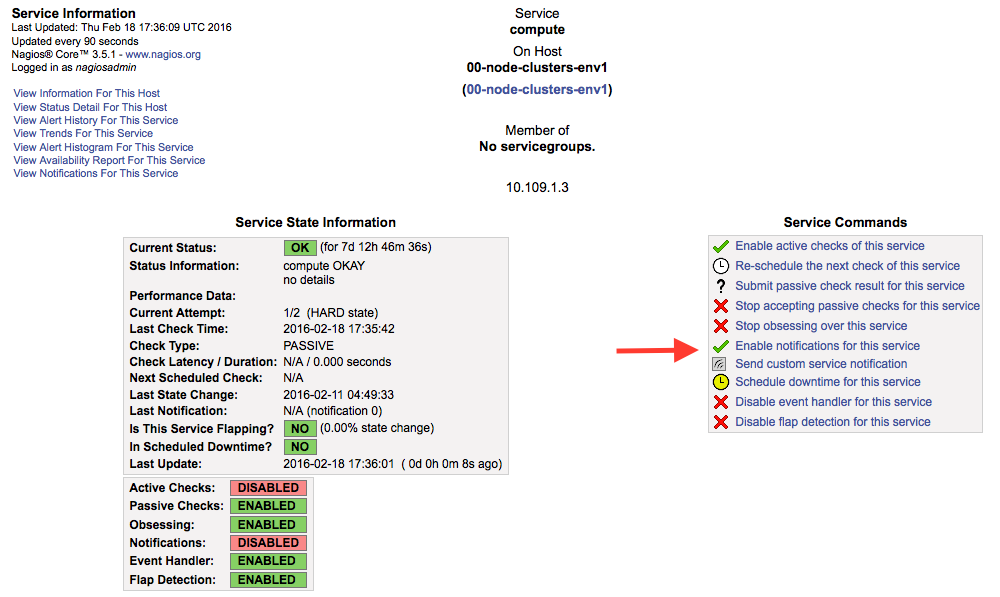
To enable alerting for nodes and clusters:
Click a particular service.
Click the Enable notifications for this service link within the Service Commands panel as shown below.
There is a direct dependency between the configuration of the passive checks in
Nagios and the configuration of the alarms in the Collectors. For details, see
the Configuring alarms section in the
StackLight Collector documentation.
A change in /etc/hiera/override/alarming.yaml or
/etc/hiera/override/gse_filters.yaml on any of the nodes monitored by
StackLight would require reconfiguring Nagios. It also implies that these two
files should be maintained rigorously identical on all the nodes of the
environment including those where Nagios is installed. StackLight provides
Puppet artifacts to help you out with that task. To reconfigure the passive
checks in Nagios when /etc/hiera/override/alarming.yaml or
/etc/hiera/override/gse_filters.yaml are modified, run the following
command on all the nodes where Nagios is installed:
# puppet apply --modulepath=/etc/fuel/plugins/\
lma_infrastructure_alerting-<version>/puppet/modules:/etc/puppet/modules \
/etc/fuel/plugins/lma_infrastructure_alerting-<version>/puppet/manifests/nagios.pp
Configuring service checks using the InfluxDB metrics
You could also configure Nagios to perform active checks, which are not performed by StakLight by default, using the metrics stored in InfluxDB’s time-series. For example, you could define active checks to be notified when the CPU activity of particular process is too high.
Consider the following scenario:
- You want to monitor the Elasticsearch server.
- The CPU activity of the Elasticsearch server is captured in a time-series stored in InfluxDB.
- You want to receive an alert at the ‘warning’ level when the CPU load exceeds 30% of system activity.
- You want to receive an alert at the ‘critical’ level when the CPU load exceeds 50% of system activity.
The steps to create such alarms in Nagios are as follows:
Connect to each of the nodes running Nagios.
Install the Nagios plugin for querying InfluxDB:
[root@node-13 ~]# pip install influx-nagios-pluginDefine the command and the service check in the
/etc/nagios3/conf.d/influxdb_services.conffile:# Replace <INFLUXDB_HOST>, <INFLUXDB_USER> and <INFLUXDB_PASSWORD> by # the appropriate values for your deployment define command { command_line /usr/local/bin/check_influx \ -h <INFLUXDB_HOST> -u <INFLUXDB_USER> -p <INFLUXDB_PASSWORD> -d lma \ -q "select max(value) from lma_components_cputime_syst \ where time > now() - 5m and service='$ARG1$' \ group by time(5m) limit 1" \ -w $ARG2$ -c $ARG3$ command_name check_cpu_metric } define service { service_description Elasticsearch system CPU host_name node-13 check_command check_cpu_metric!elasticsearch!30!50: use generic-service }Verify that the Nagios configuration is valid:
[root@node-13 ~]# nagios3 -v /etc/nagios3/nagios.cfg

   [snip]

Total Warnings: 0
Total Errors:   0
No serious problems were detected during the pre-flight check.
Restart the Nagios server:
[root@node-13 ~]# crm resource restart nagios3Go to the Nagios Web UI to verify that the service check has been added.
You can define additional service checks for different nodes or node groups using the same check_influx command. To define new service checks, provide the following required arguments:
- A valid InfluxDB query that should return only one row with a single value. See InfluxDB documentation to learn how to use the InfluxDB’s query language.
- A range specification for the warning threshold.
- A range specification for the critical threshold.
Note
Threshold ranges are defined following the Nagios format.
Using an external SMTP server with STARTTLS
If your SMTP server requires STARTTLS, perform some manual adjustments to the Nagios configuration after the deployment of your environment.
Note
Prior to enabling STARTTLS, configure the SMTP Authentication method parameter in the plugin’s settings to use either Plain, Login or CRAM-MD5.
Log in to the LMA Infrastructure Alerting node.
Open the
cmd_notify-service-by-smtp-with-long-service-output.cfgfile in the/etc/nagios3/conf.d/directory for editing.Add the
-S smtp-use-starttlsoption to the mail command. For example:define command{ command_name notify-service-by-smtp-with-long-service-output command_line /usr/bin/printf "%b" "***** Nagios *****\n\n"\ "Notification Type: $NOTIFICATIONTYPE$\n\n"\ "Service: $SERVICEDESC$\nHost: $HOSTALIAS$\nAddress: $HOSTADDRESS$\n"\ "State: $SERVICESTATE$\n\nDate/Time: $LONGDATETIME$\n\n"\ "Additional Info:\n\n$SERVICEOUTPUT$\n$LONGSERVICEOUTPUT$\n" | \ /usr/bin/mail -s "** $NOTIFICATIONTYPE$ "\ "Service Alert: $HOSTALIAS$/$SERVICEDESC$ is $SERVICESTATE$ **" \ -r 'nagios@localhost' \ -S smtp="smtp://<SMTP_HOST>" \ -S smtp-auth=<SMTP_AUTH_METHOD> \ -S smtp-auth-user='<SMTP_USER>' \ -S smtp-auth-password='<SMTP_PASSWORD>' \ -S smtp-use-starttls \ $CONTACTEMAIL$ }Note
If the server certificate is not present in the standard directory, for example,
/etc/ssl/certson Ubuntu, specify its location by adding the-S ssl-ca-file=<FILE>option.To disable the verification of the SSL/TLS server certificate altogether, add the
-S ssl-verify=ignoreoption instead.Verify that the Nagios configuration is correct:
[root@node-13 ~]# nagios3 -v /etc/nagios3/nagios.cfgRestart the Nagios service:
[root@node-13 ~]# crm resource restart nagios3